Estimation
Based on the following lectures
(1) “Statistics (2018-1)” by Prof. Sang Ah Lee, Dept. of Economics, College of Economics & Commerce, Kookmin Univ.
(2) "Statistical Models and Application (2024-1)" by Prof. Yeo Jin Chung, Dept. of Data Science, The Grad. School, Kookmin Univ.

Point Estimator
-
점 추정량(Point Estimator) : 모수를 추정하는 하나의 값(Single Value)
표기 평균 분산 비율 모수 $\theta$ $\mu$ $\sigma^2$ $\pi$ 점 추정량 $\hat{\theta}$ $\overline{X}$ $S^2$ $P$ -
불편 추정량(Unbiased Estimator) : 기대값이 모수와 같아 모수로부터 음이나 양으로 편향되지 아니한 추정량
\[\begin{aligned} \mathrm{Bias}\left[\hat{\theta}\right] = \mathbb{E}\left[\hat{\theta}\right] - \theta = 0 \end{aligned}\] -
효율적 추정량(Efficient Estimator) : 모수의 불편 추정량 중 분산이 최소인 불편 추정량
\[\begin{aligned} \min{\mathbb{E}\left[(\hat{\theta}-\theta)^2\right]} = \min{\left(\mathrm{Var}[\hat{\theta}] + \mathrm{Bias}[\hat{\theta}]^2\right)} \end{aligned}\]- BLUE(
BestLinearUnbiasedEstimator): 불편 선형 추정량 중 가장 효율적인 추정량으로서, 대표적으로 표본평균 $\overline{X}$ 가 모평균 $\mu$ 의BLUE임
- BLUE(
-
일치 추정량(Consistent Estimator) : 표본의 크기 $n$ 이 커질수록 평균자승오차가 $0$ 에 수렴하는 추정량
\[\begin{aligned} \lim_{n \rightarrow \infty}{\mathbb{E}[(\hat{\theta}-\theta)^{2}]} &= \lim_{n \rightarrow \infty}{\mathrm{Var}[\hat{\theta}]} + \lim_{n \rightarrow \infty}{\mathrm{Bias}^{2}[\hat{\theta}]}\\ &= 0 \end{aligned}\]
Confidence Intervals
-
신뢰 구간(Confidence Intervals) : 신뢰 가능한 수준 하에서 모수를 포함할 수 있다고 추정되는 구간으로서 신뢰수준을 담보한 구간 추정량(Interval Estimator)
\[\text{CI}:=\left(\overline{X}-z_{\alpha/2}\times \frac{\sigma}{\sqrt{n}}, \overline{X}+z_{\alpha/2}\times \frac{\sigma}{\sqrt{n}}\right)\]-
신뢰수준(Confidence Level) : 신뢰구간이 담보하는, 해당 구간이 모수를 포함할 가능성으로서, $N$ 번의 반복실험에서 신뢰구간이 모수를 포함하는 상대 빈도
\[P(\mu \in \text{CI})=1-\alpha\] -
오차한계(Margin of Error) : 모수 $\mu$ 와 그 점 추정량 $\overline{X}$ 에 대하여 신뢰구간의 끝(한계)과 $\mu$ 사이의 최대 차이로서, $\mu$ 와 $\overline{X}$ 의 차이(오차)를 수용할 수 있는 범위를 결정하는 값
\[z_{\alpha / 2} \times \frac{\sigma}{\sqrt{n}}\]
-
-
신뢰구간의 길이(Length)
\[\text{Length}(\text{CI}) = 2 \times z_{\alpha/2} \times \frac{\sigma}{\sqrt{n}}\]- $(1-\alpha)\uparrow \; \Rightarrow L\uparrow$ : 신뢰수준이 높을수록 신뢰구간의 길이가 증가함
- $\sigma\uparrow \; \Rightarrow L\uparrow$ : 모집단의 분포가 널리 퍼져 있을수록 정확한 추정이 어려워 신뢰구간의 길이가 증가함
- $n\downarrow \; \Rightarrow L\uparrow$ : 표본의 크기가 작을수록 정확한 추정이 어려워 신뢰구간의 길이가 증가함
-
신뢰구간의 도출
-
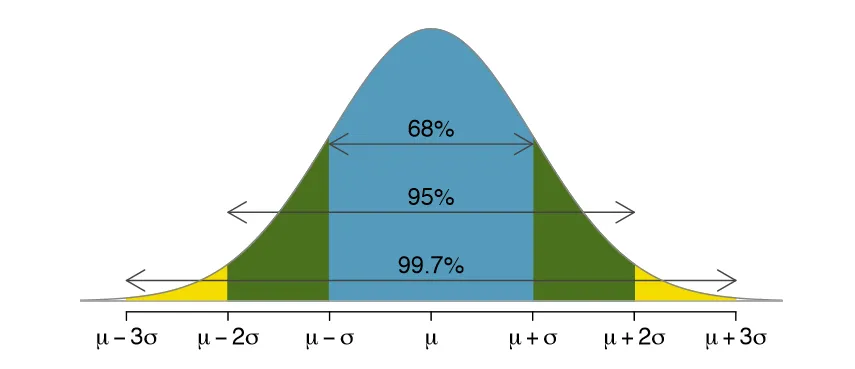
중심극한정리에 의해 $n$ 이 충분히 크면 다음이 성립함
\[\begin{aligned} \overline{X} \sim N(\mu, \frac{\sigma^2}{n}) \end{aligned}\] -
확률변수 $\overline{X}$ 를 다음과 같이 표준화할 수 있음
\[\begin{aligned} Z=\displaystyle\frac{\overline{X} - \mu}{\displaystyle\frac{\sigma}{\sqrt{n}}} \sim N(0,1) \end{aligned}\] -
$100(1-\alpha)\%$ 신뢰수준 하 신뢰구간은 다음과 같음
\[\begin{aligned} P(-z_{\alpha/2}<Z<z_{\alpha/2}) &=P(-z_{\alpha/2}<\displaystyle\frac{\overline{X}-\mu}{\displaystyle\frac{\sigma}{\sqrt{n}}}<z_{\alpha/2})\\ &=P(-z_{\alpha/2}\times \displaystyle\frac{\sigma}{\sqrt{n}}<\overline{X}-\mu<z_{\alpha/2}\times \displaystyle\frac{\sigma}{\sqrt{n}})\\ &=P(-\overline{X}-z_{\alpha/2}\times \displaystyle\frac{\sigma}{\sqrt{n}}<-\mu<-\overline{X}+z_{\alpha/2}\times \displaystyle\frac{\sigma}{\sqrt{n}})\\ &=P(\overline{X}-z_{\alpha/2}\times \displaystyle\frac{\sigma}{\sqrt{n}}<\mu<\overline{X}+z_{\alpha/2}\times \displaystyle\frac{\sigma}{\sqrt{n}})\\ &=1-\alpha \end{aligned}\]
-